GPcov provides functions to create a covariance matrix for Gaussian processes with different dependence models
Installation
You can install the most recent version of GPcov in the following way
library(devtools)
devtools::install_github("avramaral/GPcov", build_vignettes = TRUE)
Example
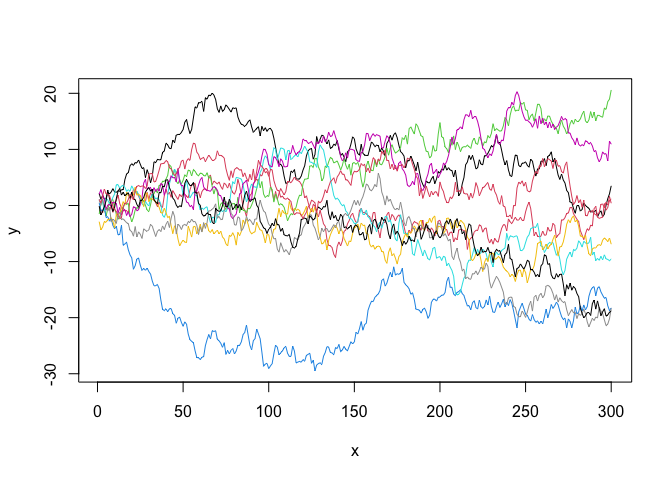
As a simple example, suppose we want to simulate n = 10 curves from a zero-mean Gaussian process covariance function given by (namely Brownian Motion). This can be achieved by using the
compute_cov_matrix() function from GPcov package, and the mvrnorm() function from the MASS package.
library(GPcov)
library(MASS)

set.seed(1)

x <- data.frame(seq(from = 1, to = 300, by = 1))
C <- compute_cov_matrix(points = x, cov_func = "brownian_motion")

GP <- mvrnorm(n = 10, mu = rep(0, nrow(C)), Sigma = as.matrix(C))
plot(GP[1, ], type = 'l', ylim = c(min(GP), max(GP)), xlab = 'x', ylab = 'y')
for (i in 2:nrow(GP)) {
  lines(GP[i, ], col = i)
}
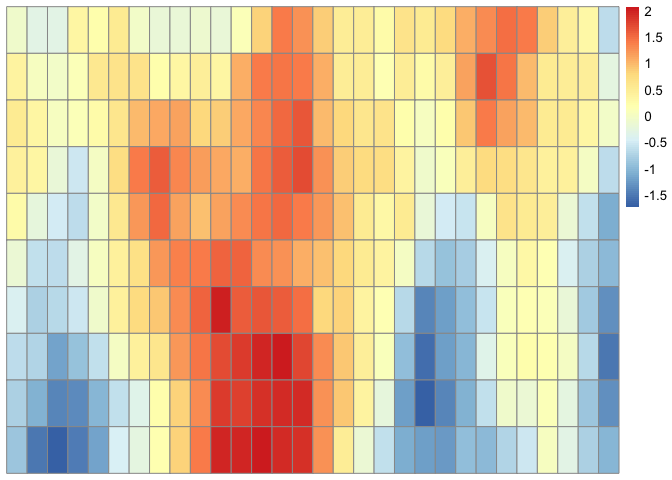
Alternatively, suppose we want to simulate a Matérn process in . This can be done in the following way.
library(pheatmap)

x <- seq(1, 30)
y <- seq(1, 10)
z <- expand.grid(x, y)

C  <- compute_cov_matrix(points = z, cov_func = "matern_model", sig2 = 1, nu = 1, beta = 5)
GP <- mvrnorm(n = 1, mu = rep(0, nrow(C)), Sigma = as.matrix(C))
GP <- matrix(data = GP, nrow = length(y), ncol = length(x), byrow = TRUE)
pheatmap::pheatmap(GP, cluster_rows = FALSE, cluster_cols = FALSE)